This companion to Saturation: An Elemental Politics (Duke University Press, 2021) offers a brief selection of color images from the book, where copyright permits.

Figure I.1: Samples collected during the Thomas Fire by by Kelsey Bisson and Eleanor Arrington. Photograph by Melody Jue, 2018.

Figure 1.1: Color-coded map of aragonite saturation as projected in 2013 forward for the year 2100. From International Geosphere-Biosphere Programme, Intergovernmental Oceanographic Commission-unesco, Scientific Committee on Oceanic Research. 2013. Ocean Acidification Summary for Policymakers—Third Symposium on the Ocean in a High-CO2 World. International Geosphere-Biosphere Programme,Stockholm, Sweden.

Figure 1.2: “Sea surface temperatures in 2001 as measured using the Terra-Earth-observing satellite.” From Plait 2017. Image by Jacques Descloitres, modis Land Rapid Response Team, nasa/gsfc.
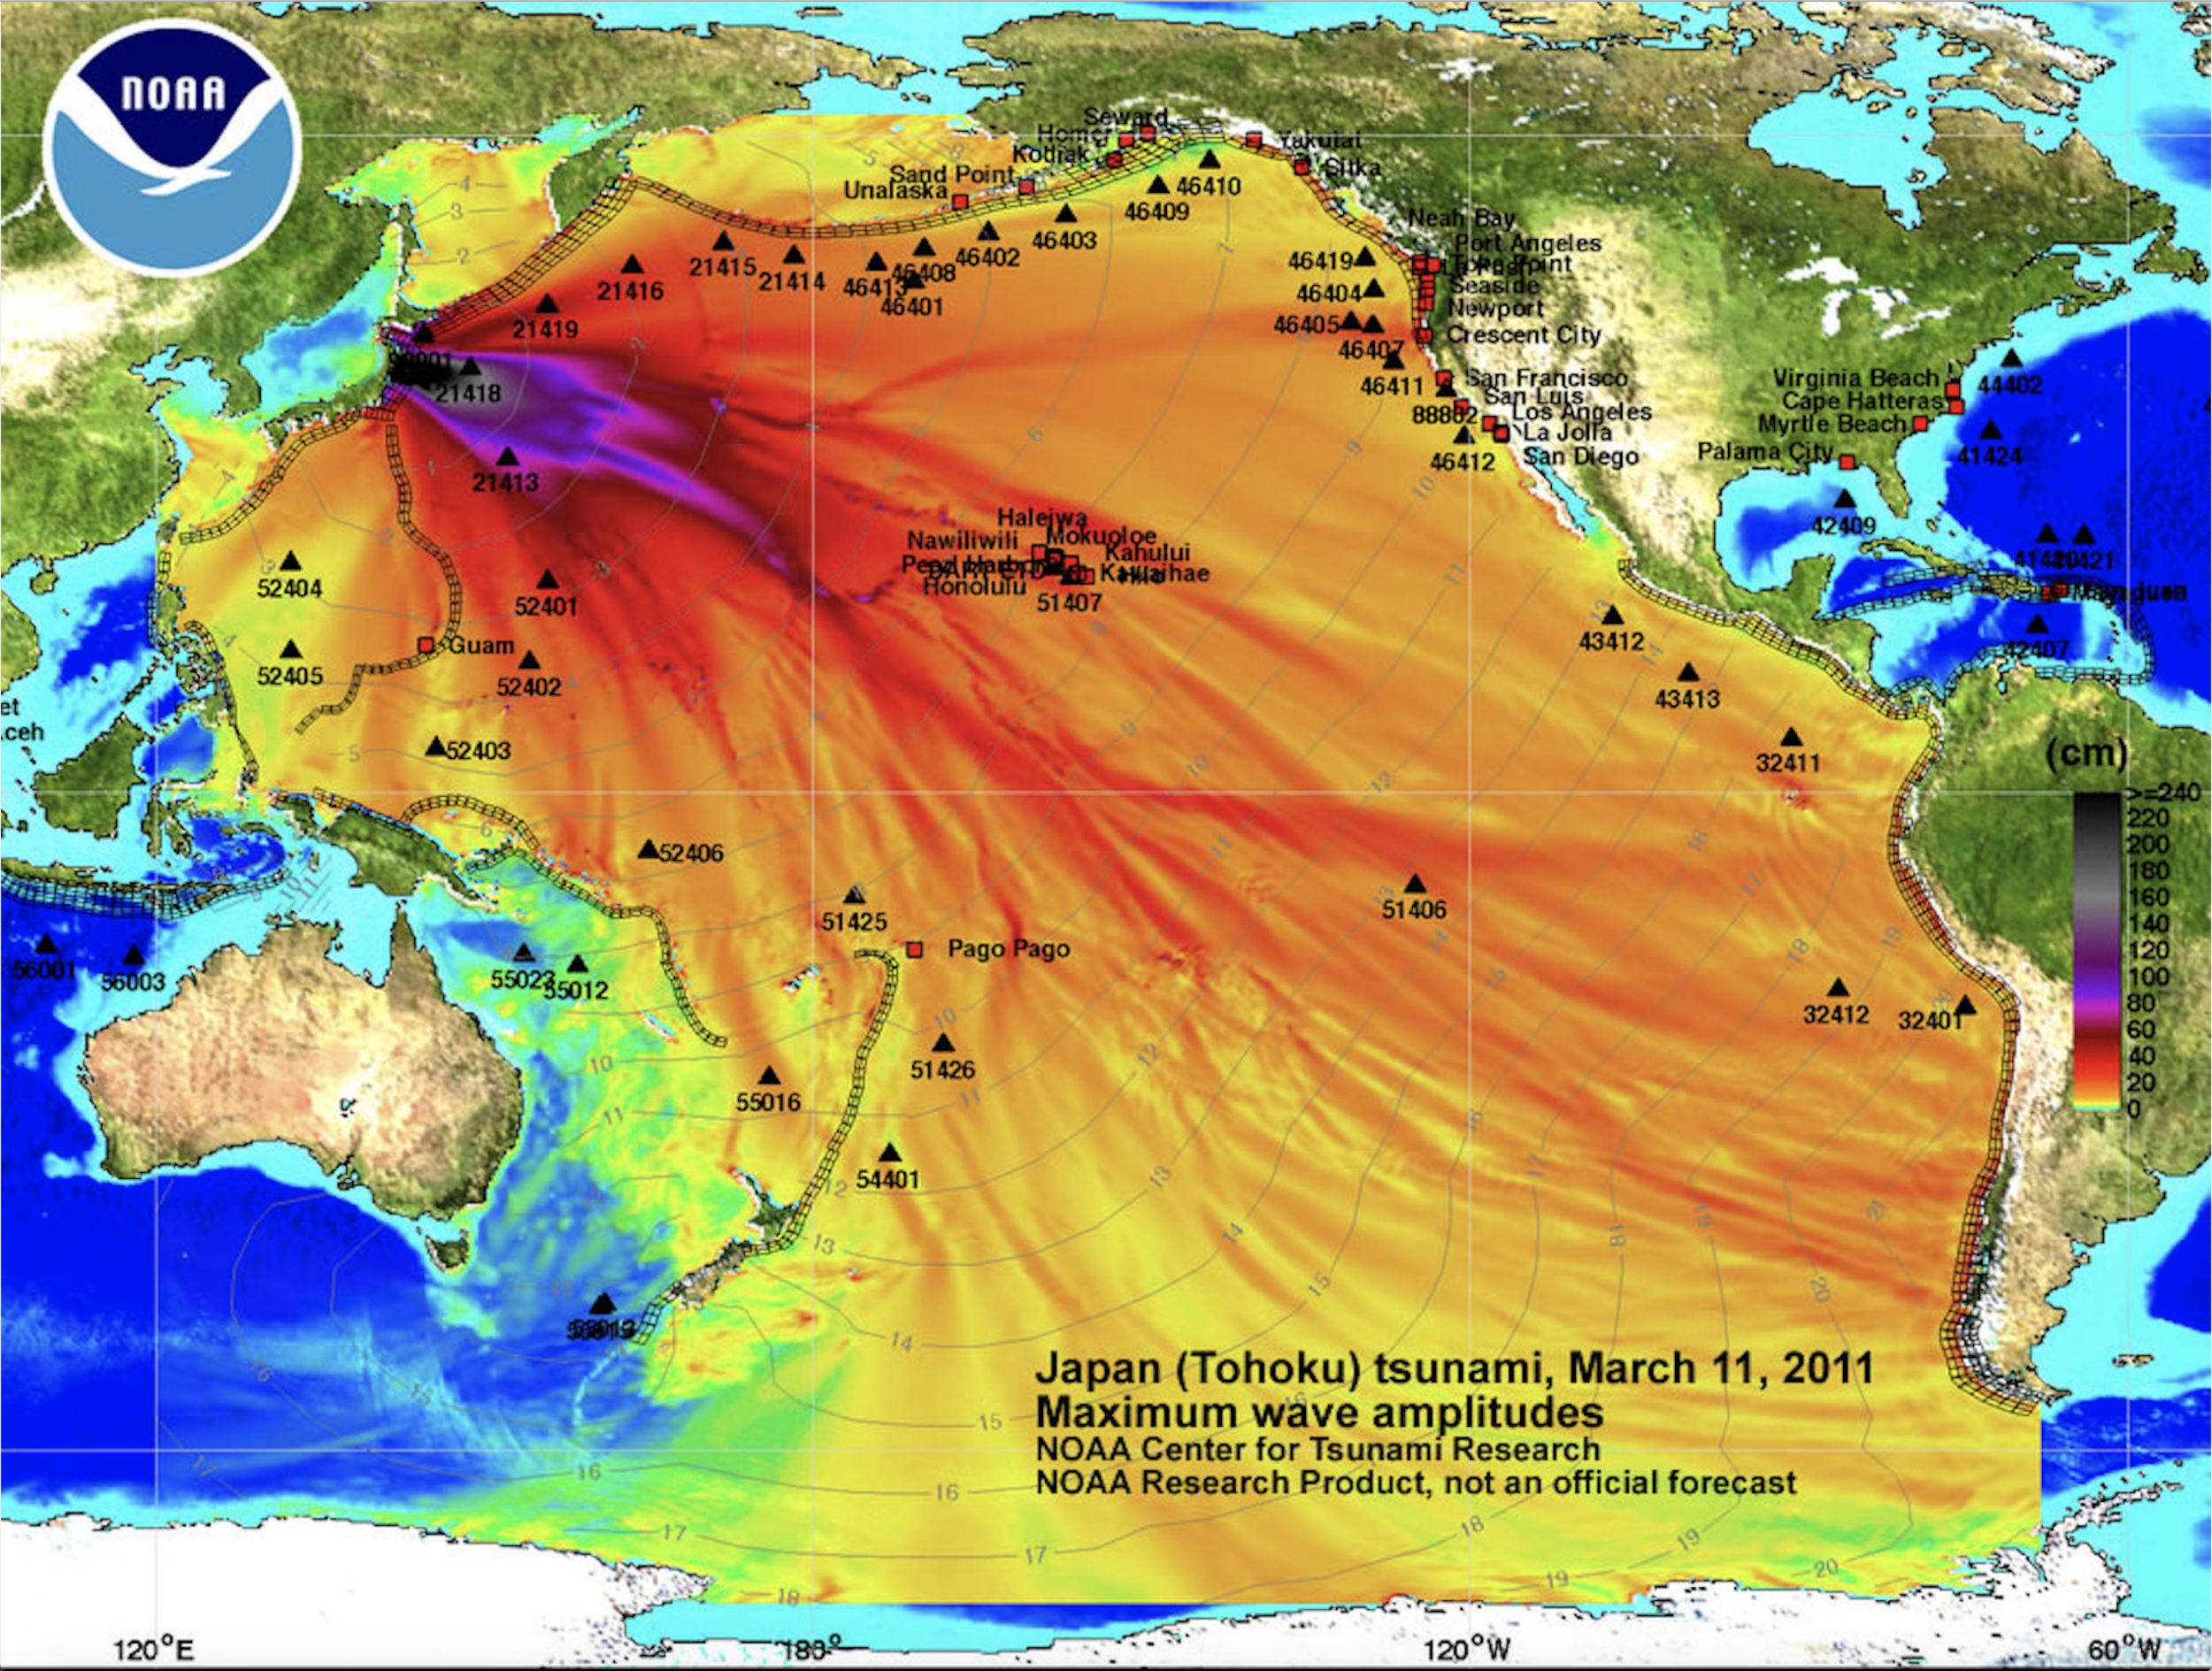
Figure 1.3: “Japan (Tōhoku) tsunami, March 11, 2011, Maximum wave amplitudes, NOAA Center for Tsunami Research, NOAA Research Product, not an official forecast.” http://nctr.pmel.noaa.gov/honshu20110311/Energy_plot20110311-1000_ok.jpg.


Figure 2.1: Composite image of photos taken in Hydropolis and showing its various screens, 2016. Photograph by Joanna Zylinska.

Figures 2.2: Pippin Bar, “Unity Building” from v r 3, 2017.

Figure 4.1: Scene from Das Boot (Wolfgang Petersen, 1981).
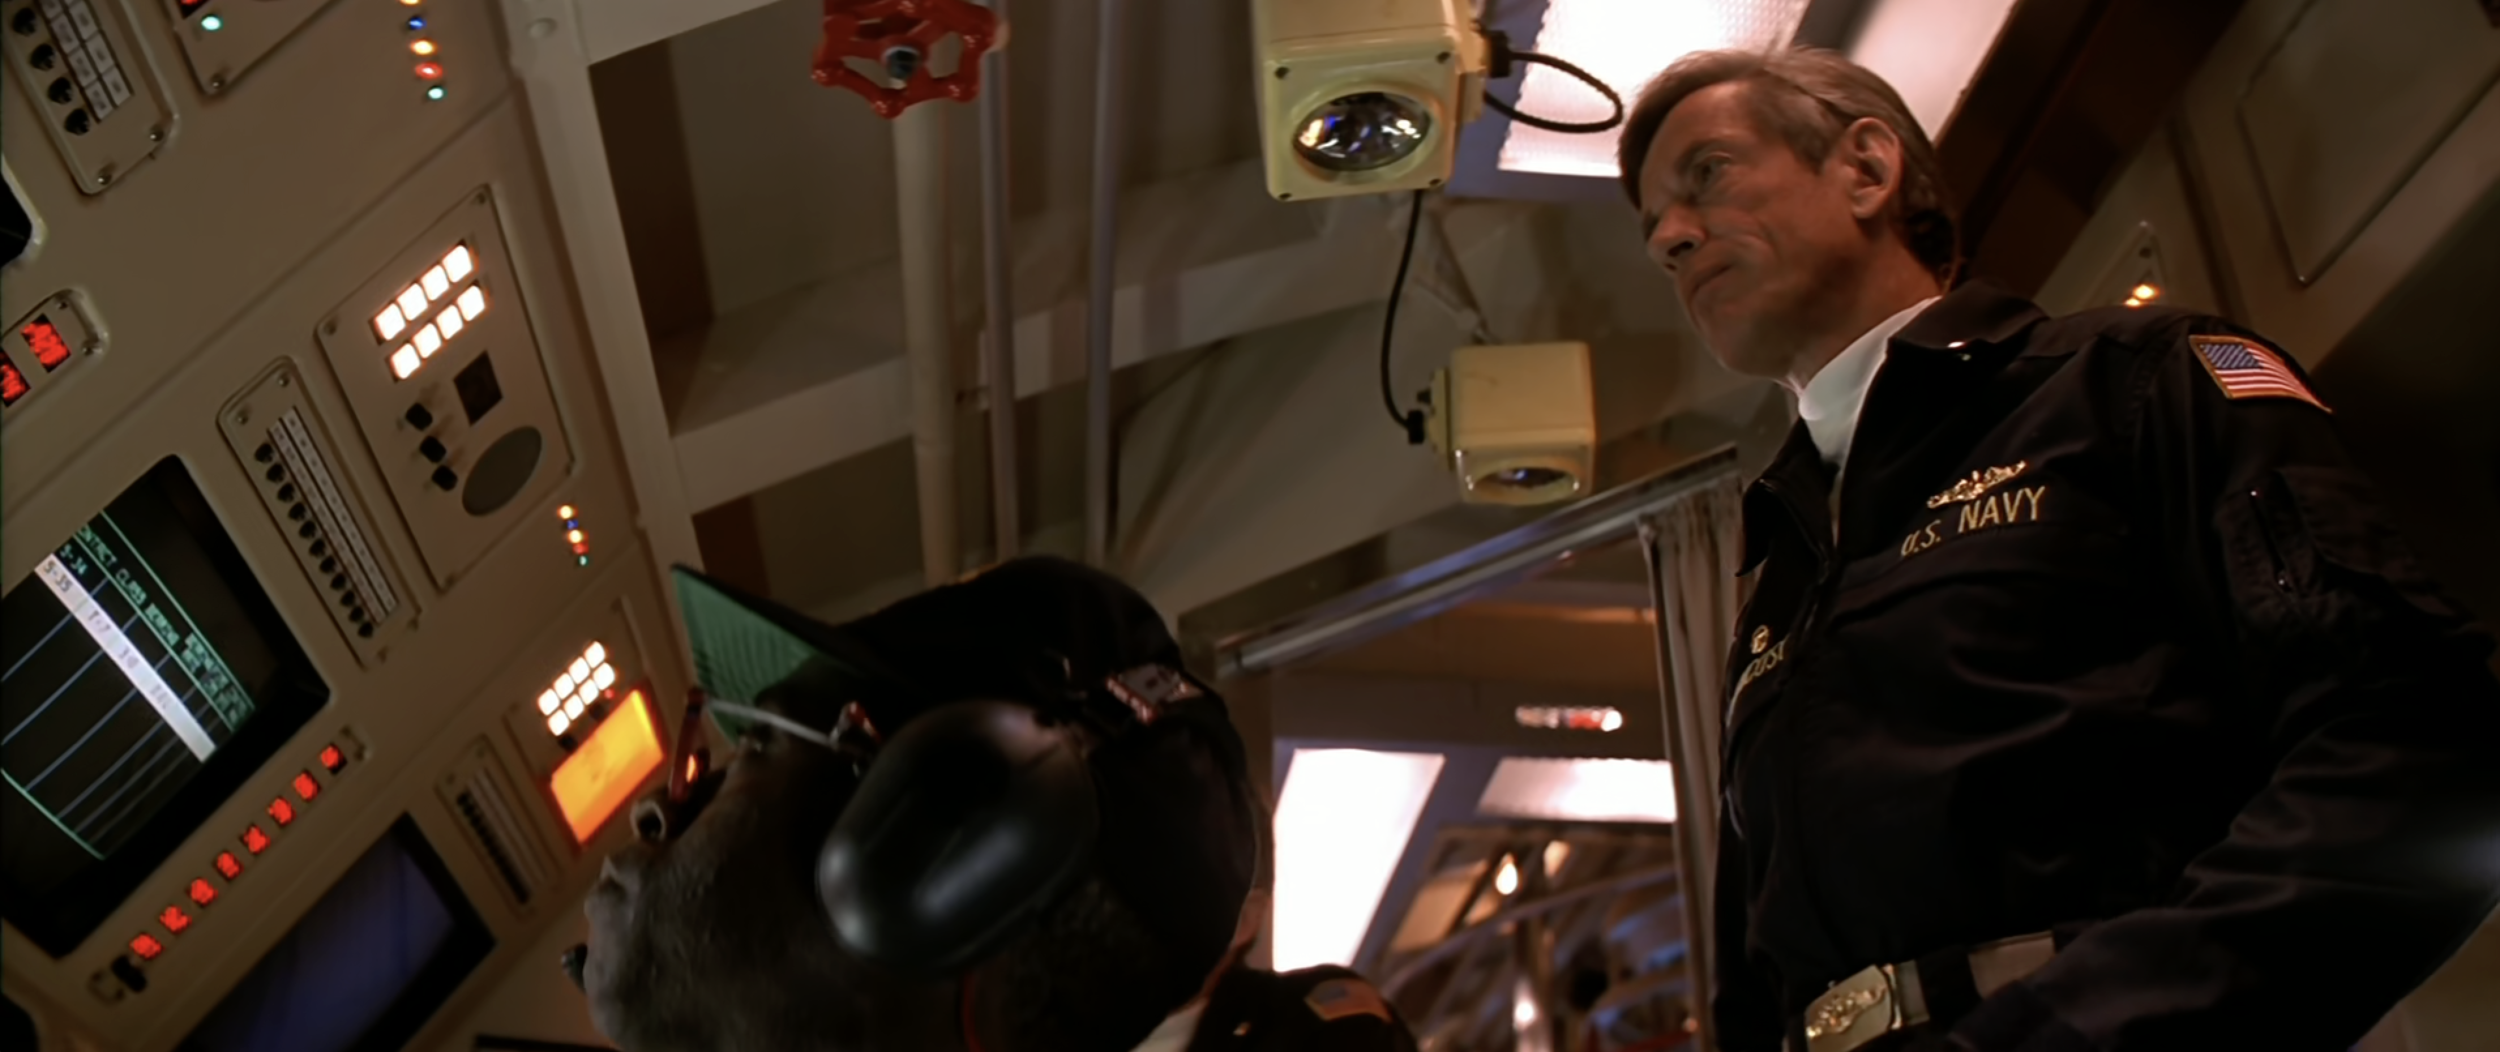
Figure 4.2: Improvisation is replaced by acoustic labor as Jonesy returns to his post after Watson’s story in The Hunt for Red October.

Figure 5.1: Chuck’s flight with silver/aluminum cloth protection (screen grab from Better Call Saul).

Figure 7.2: Dried blood sample collection at an arv adherence club.

Figure 8.3: Red seaweed in the Algal Herbarium at UC Santa Barbara Cheadle Center for Biodiversity and Ecological Restoration. Image by Melody Jue.

Figure 8.5: Cyanotype by Anna Atkins in British Algae: Cyanotype Impressions (1843).
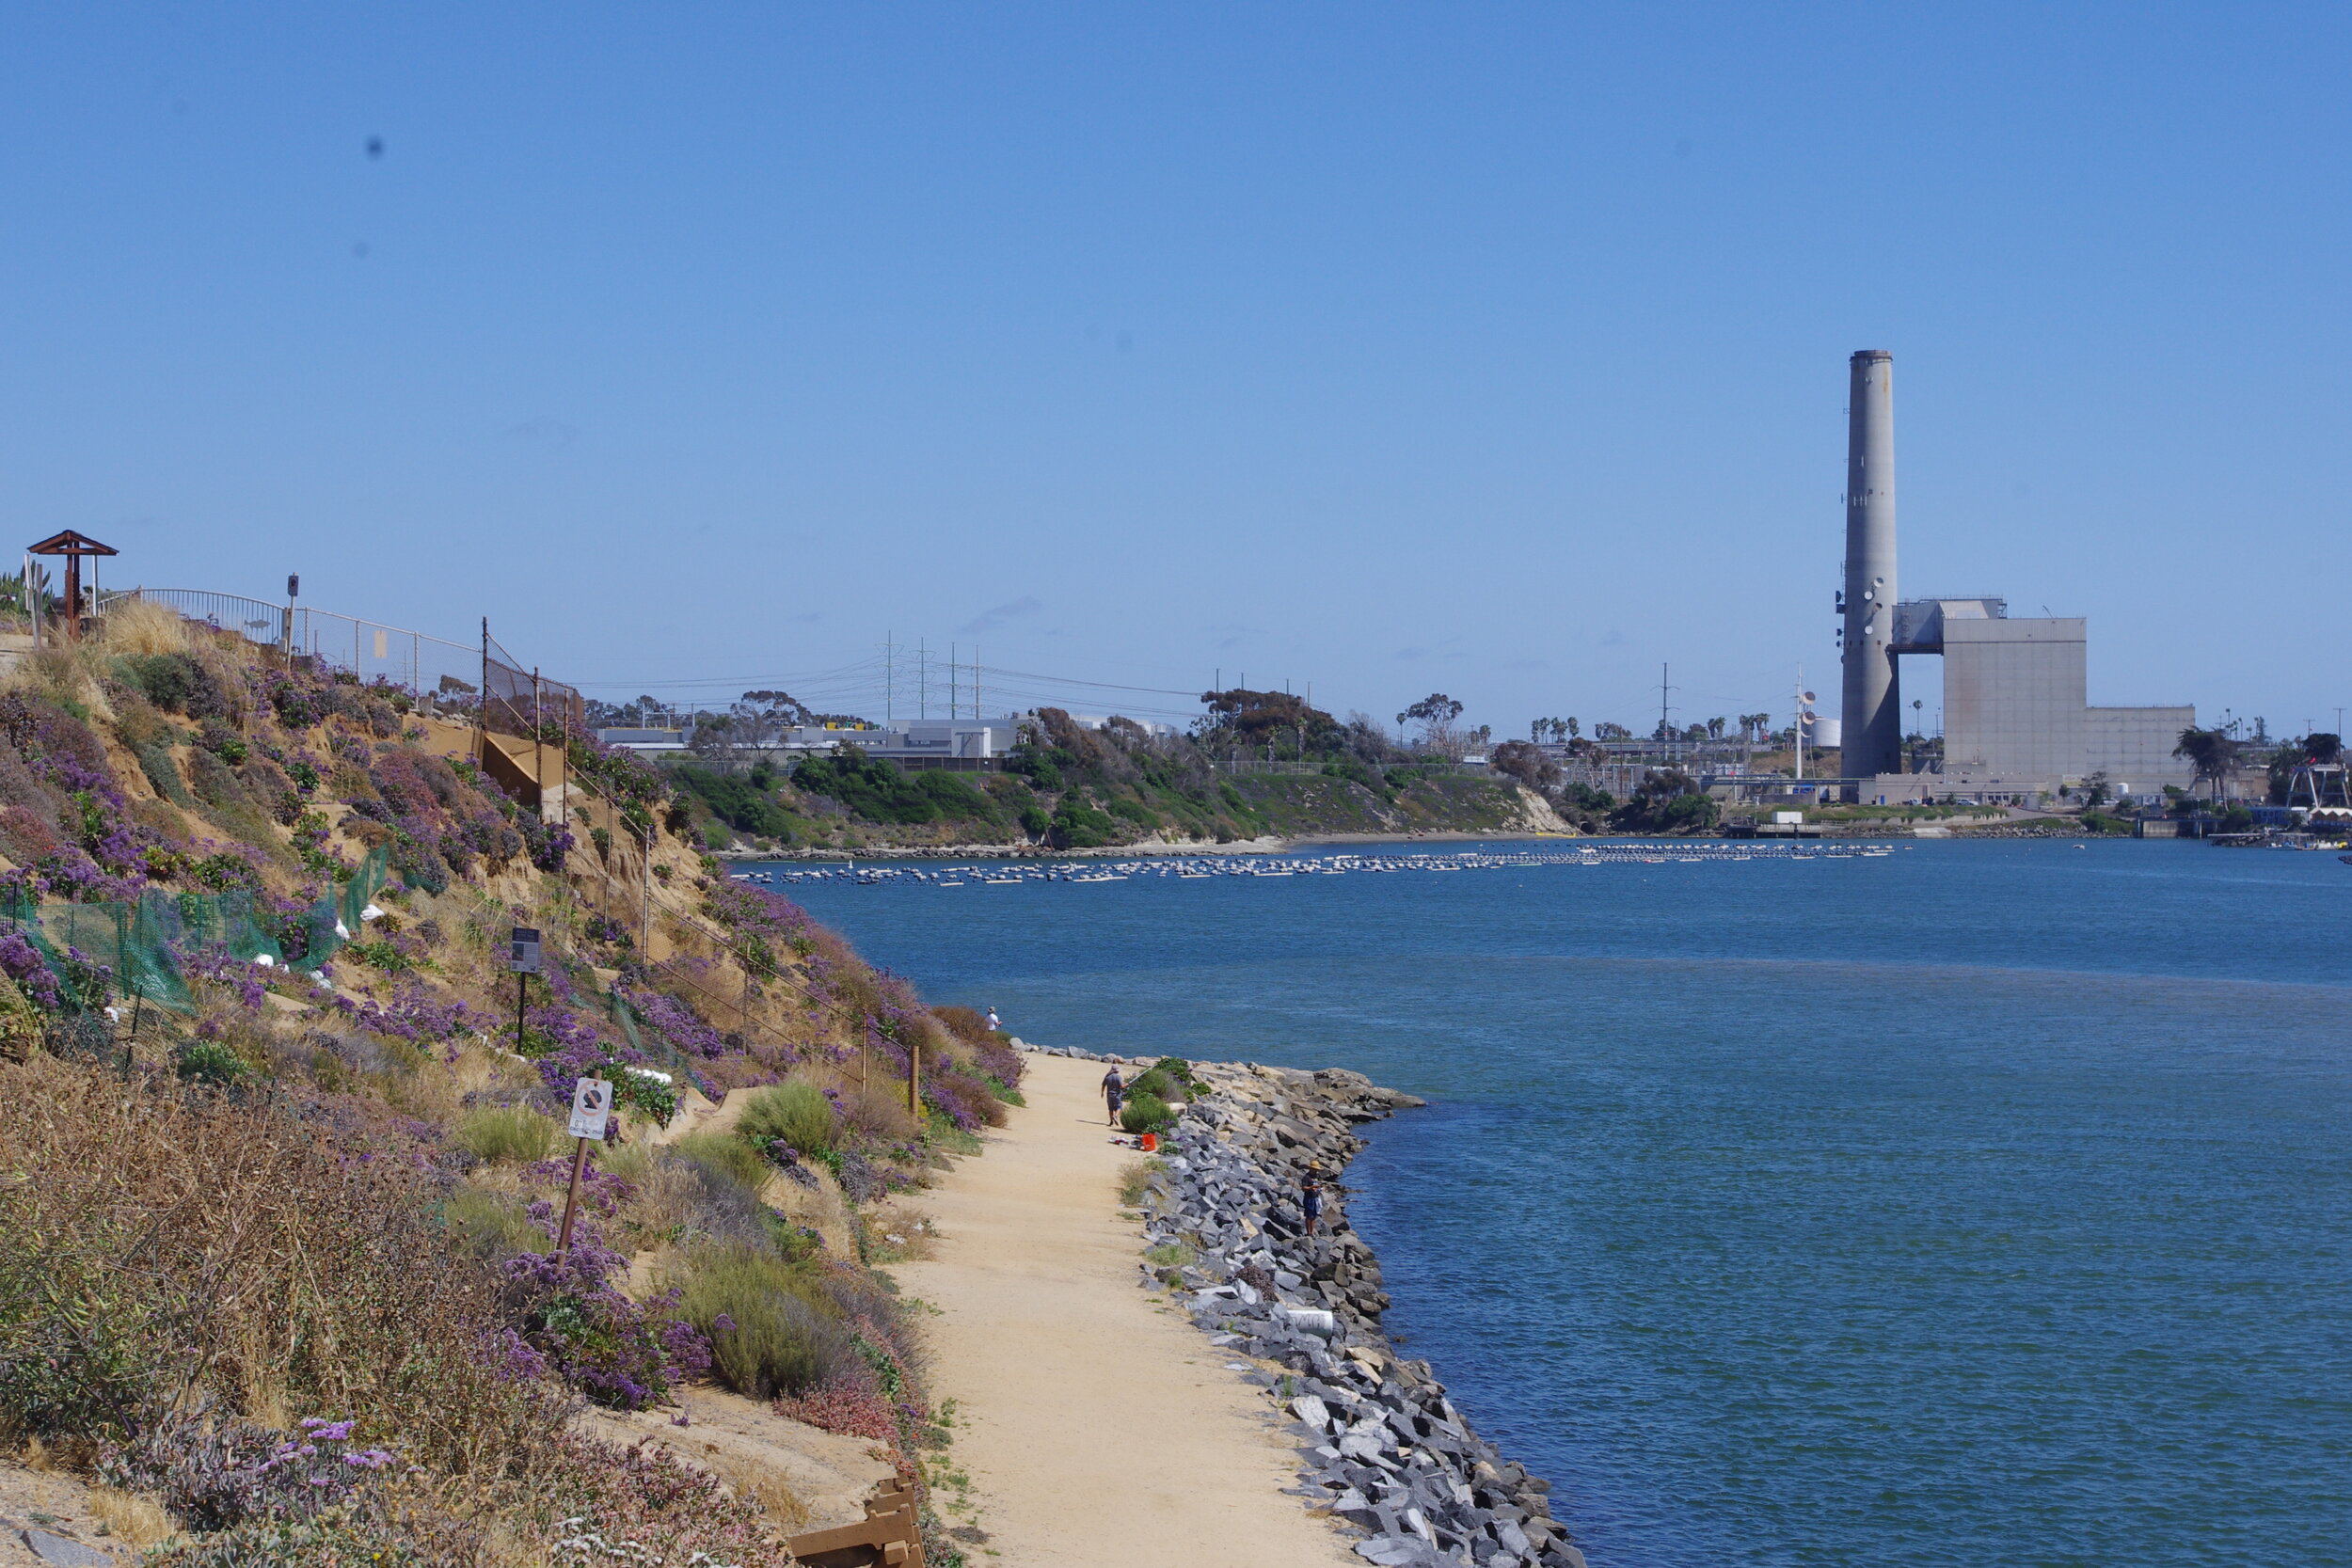
Figure 9.1: View of Poseidon Desalination Plant and Encina Power Station from Agua Hedionda Lagoon. Photo credit: Rafico Ruiz

Figure 11.2: Goddess Kali presides over pirated media. Photo credit: Bhaskar Sarkar.

Figure 13.1: The Chanel “bot” on the data center-themed Paris Fashion Week runway.

Figure 13.4: “Milk-producing data centers. Imagine that.” Dell Technologies advertisement. Photo taken by Susan Cahill in Copenhagen, 2018. Courtesy of Susan Cahill.

Figure 8.1: Giant kelp (Macrocystis pyrifera), UCSB Algal Herbarium.

Figure 8.6: Hand-drawn or arranged title to British Algae: Cyanotype Impressions (1843).

Figure 9.2: Entry gate to Poseidon Desalination Plant. Photo credit: Rafico Ruiz.

Figure 11.1: Pirated vcds and puffed rice treats. Photo credit: Bhaskar Sarkar.

Figures 11.3 and 11.4: Butterflies flutter in the vicinity of a dying woman. Ashani Sanket (dir. Satyajit Ray, cinematography Soumendu Roy, 1973).